Managing a group of dental practices is a portfolio problem. The questions change from how is my practice doing to which of my practices need attention this week, and which are doing something the others should copy.
Multi-location analytics software answers those questions. Here is what group analytics needs to deliver and how leadership uses it.
What does multi-location analytics need to do?
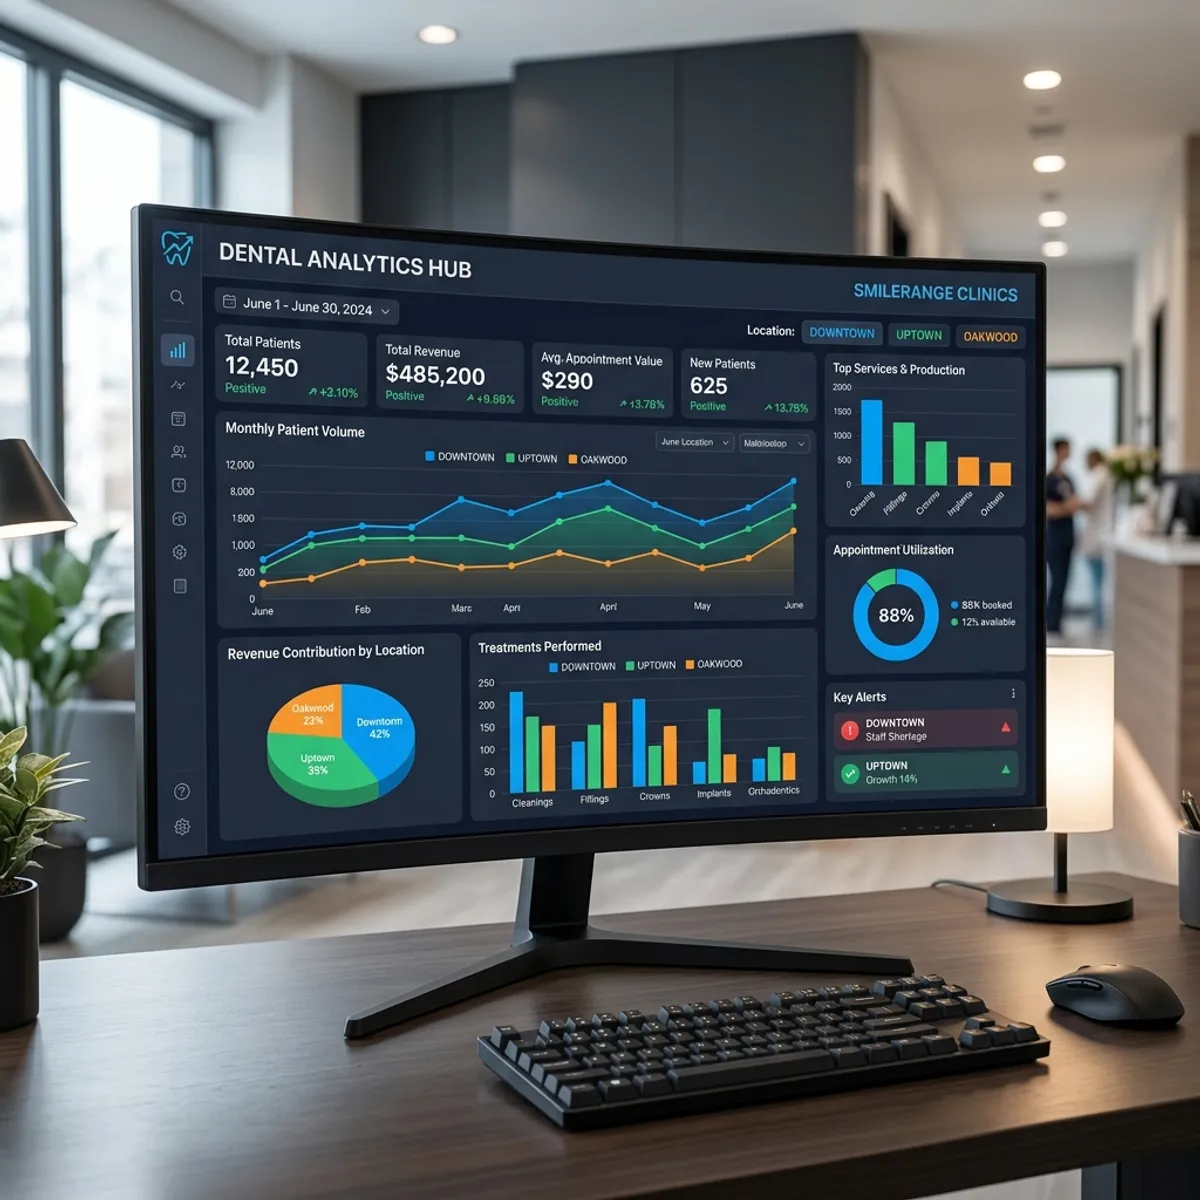
It needs to roll up performance across every location into one view, while letting leadership drill into any single office. A group-wide number is useful, but only if you can immediately see which locations are driving it.
It also needs standardized, comparable KPIs across locations, so a strong month at one office can be measured against the others on the same terms. Without comparability, you cannot benchmark, and benchmarking is the whole point of group analytics.
Why is comparability across locations essential?
If each location measures and reports differently, leadership is comparing apples to oranges and cannot tell which offices are genuinely outperforming. Standardized KPIs fix that.
When every location reports production, schedule density, new patients, case acceptance, and recall effectiveness the same way, leadership can rank and compare them. That reveals the high performers worth learning from and the strugglers worth helping, on a like-for-like basis.
What should group analytics track?
The core KPIs, rolled up and comparable across locations.
- Production by location, provider, and the group as a whole
- Schedule density per location to spot underused chair time
- New patient count and source by location
- Case acceptance rates across offices
- Recall and recare effectiveness by location
- No-show and cancellation rates
- Collections and accounts receivable by location
How does automated reporting help group leadership?
Manually compiling reports from many locations is slow and consumes the time leadership should spend acting on the data. Automated group reporting delivers the unified view continuously, with no manual assembly.
That timeliness matters. Seeing a location's density problem this week lets leadership intervene this week. Discovering it in a quarterly report compiled by hand is too late. Automated, real-time group analytics turns reporting into management.
How do analytics and automation work together across a group?
Analytics identifies which locations have which problems; automation fixes them at scale. If several locations show recall leakage, group-wide automated recall closes it. If after-hours call abandonment shows up across the portfolio, deploying the AI Dental Receptionist group-wide captures those calls everywhere at once.
The combination is powerful for groups: see the pattern across the portfolio, then deploy a fix across the portfolio. Leadership manages by exception, and the automation handles the execution consistently across every location.
Frequently Asked Questions
What does multi-location dental analytics software do that single-office analytics does not?
Why does standardizing KPIs across locations matter?
Can group analytics work with automation?
How current should group analytics be?
See PatientXpress in action
Book a 20-minute demo and see how our platform answers calls, books appointments, and runs your practice automations inside the software your team already uses.
Book a Demo